 One of the aspects of the statistical analysis of hockey that has been cited as a reason not to trust the results that have been generated is the quality of the data produced by the NHL’s Real Time Scoring System (RTSS). Here is an article with some NHL GM’s talking about the quality of the data. Also there have been several studies that have found that there are inconsistencies in the recording of these events from rink to rink. These studies include work by Boyle, Zona, Desjardins, McCurdy, Fischer and Awad. The inconsistencies enumerated include the location of shots, the amount of shots, the differences between giveaways and takeaways. This is an important issue for data analysis of hockey. Since many advanced analytic methodologies, e.g. CorsiRel, Fenwick, Macdonald’s Expected Goals, Schuckers and Curro’s Total Hockey Ratings, depend on the RTSS data, it would be useful to account for those rink differences. Brian Macdonald (@greaterthanpm) and I (@SchuckersM) have been working to do just that: estimate the differences in recording tendencies at each rink in order to adjust for those effects. We introduce that work below.
Our aim is to build a model which accounts for the relative differences between rinks on the events that are recorded. The rest of this post is a summarized version of our paper on this topic which is linked below. The focus of this work is in making data recorded for the following events comparable from rink to rink: Blocks, Giveaways, Hits, Missed Shots, Shots, and Takeaways. We also look at the recording of aggregated events that count as Corsi events, Fenwick events and Turnovers. The last of these was created by Schuckers and Curro to account for the home bias of Takeaways and Giveaways as part of the THoR paper.
The data that we use for this analysis comes from the nhlscrapr R package created by Thomas and Ventura and includes 6858 games from six regular seasons.
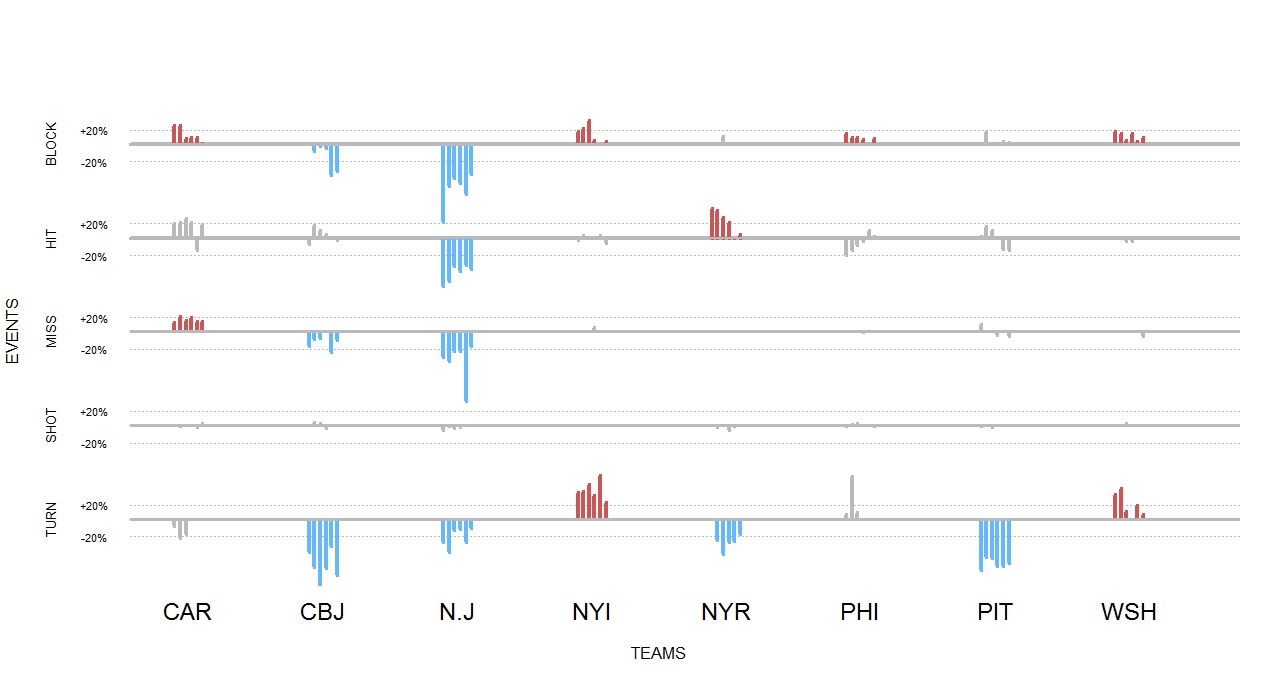
We used a statistical regression to model counts of events per game with several predictors including team factors, average score differential, and rink. The estimated rink effects that we derive can be used to reweight recorded events so that can have comparable counts of events across rinks. Applying our methodology to data from six regular seasons (2007-08 through 2012-13), we find that for the most part NHL rinks (and the individuals therein) do a reasonably consistent job of recording events. This is especially true of the recording of SHOTs, which has the fewest rinks with significant recording issues and has the smallest rink effects that we found. We only found that St. Louis and Florida have rates for the recording of rinks that differ significantly from other rinks. Florida counts shots at a rate that is about 3% higher than other rinks while St. Louis counts shots at a rate that is 4.5% lower than the rest of the league.
However, there are some rinks with rink effects that are significant and consistent across these seasons for other events. Zeroing in on blocks, hits and misses, there were four rinks that consistently inflated or deflated the counts of those events: Edmonton, Los Angeles, New Jersey and Toronto. There were also six rinks that were not significantly different from the rest of the league on those events. These were: Buffalo, Nashville, Pittsburgh, St. Louis, Tampa Bay and Vancouver.
While event counts are impacted by rink effect, ratios of events such as Corsi For Percentage remain relatively unaffected. The table below demonstrates how small the impact of rink effects are on the Corsi For %. This despite our estimation that Boston, Columbus, Edmonton, Los Angeles, New Jersey, and Toronto all have significant rink effects for the counting of Corsi events. New Jersey is particularly egregious, undercounting Corsi events by about 16%. The reason that ratios are not impacted as much as counts is that the impact of a given rink is felt in both the numerator and the denominator for the home team.
Table 1: Comparison of Corsi For % and Adjusted Corsi For % for 2012-13 NHL Regular Season
Top 5 and Bottom 5 teams on Corsi For Pct.
| Team | Corsi For Pct. | Adjusted Corsi For Pct. |
| L.A. | 0.5630 | 0.5628 |
| N.J. | 0.5592 | 0.5592 |
| BOS | 0.5433 | 0.5430 |
| CHI | 0.5414 | 0.5420 |
| DET | 0.5366 | 0.5365 |
| … | … | … |
| CBJ | 0.4711 | 0.4706 |
| NSH | 0.4668 | 0.4662 |
| BUF | 0.4512 | 0.4513 |
| EDM | 0.4458 | 0.4445 |
| TOR | 0.4408 | 0.4398 |
While ratios are not affected in a major way by rink effects, the counts of individual events recorded as part of the NHL’s RTSS system are. To illustrate this we looked at the Block shots recorded by players during the 2012-13 NHL Regular season. For those rinks where there are rink effects for block shots, we take each block and weight it by 1 divided by the rink effect. So that for Nassau Coliseum home of the New York Islanders, NYI, each block counts as 1/1.208 or 0.828 of a block since that rink overcounts blocks by about 20.8%. Similarly, since the rink effect for Anaheim is 0.721, each block in that rink counts as 1/0.721 or 1.387 of a block.
We adjusted every block during the 2012-23 regular season for the rink in which it occurred and the top 10 players on adjusted blocks is given in the table below. Unlike the case for Corsi For %, there are substantial changes for the counts of block events. Here the top player on the revised list, Francois Beauchemin, was originally ranked 10th on the list of players with the most blocks. There are other large changes for players from the Islanders (Andrew MacDonald) and the Capitals (John Carlson) due to the relative counting of BLOCKs in those rinks. Macdonald and Carlson move from tied for third in raw BLOCKs to eighth and ninth, respectively, after our adjustment.
Table 2: Comparison of Raw Block Counts and Adjusted Block Counts for 2012-13 NHL Regular Season
Top 10 players based on Adjusted Block Counts
| Player | Team | Adjusted Blocks | Raw Blocks | Differential |
| F. Beauchemin | ANA | 133.3 | 111 | 22.3 |
| G. Zanon | COL | 127.2 | 124 | 3.2 |
| D Girardi | NYR | 120.7 | 125 | -4.3 |
| R Hainsey | WPG | 120.5 | 123 | -2.5 |
| D Seidenberg | BOS | 119.8 | 115 | 4.8 |
| L Smid | EDM | 114.7 | 119 | -4.3 |
| B Orpik | PIT | 110.3 | 114 | -3.7 |
| A MacDonald | NYI | 109.8 | 123 | -13.2 |
| J Carlson | WSH | 109.4 | 123 | -13.6 |
The full paper can be found HERE.
Note: Brian’s contributions to this project, with the exception of minor edits of the paper, were made while he was an Associate Professor in the Department of Mathematical Sciences at the United States Military Academy, West Point, NY, prior to joining the Florida Panthers.


Leave A Comment