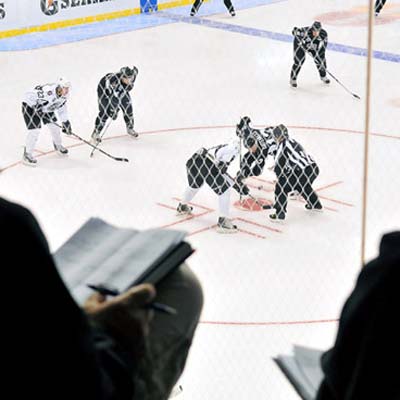
This past Spring, two students of Schuckers did undergraduate honors theses at St. Lawrence analyzing NHL data. Tom Pasquali who is now a graduate student in Statistics at Villanova University focused on faceoffs while another student, Jim Curro (now a graduate student in Statistics at Iowa State), did some work on player ratings. In the NHL faceoff analysis that is linked below, we used primarily Tom’s work but also a portion of Jim’s work. We analyzed over 200,000 faceoffs over three NHL regular seasons (2008-9, 2009-10,and 2010-11). There are two main findings for this work.
1. It takes approximately 76 more faceoff wins than losses to gain a goal differential in the NHL. We had previously found a similar number. What we have added to our analysis is the number of wins that it takes . Thus, not all NHL faceoff wins are equal. A win on the power play or a win outside the neutral zone is more value than a win at even strength or a win in the neutral zone.
2. We also looked at rating individual players on their ability to win faceoffs accounting for faceoff prowess of the opponent, location on the ice (offensive, defensive or neutral zone), the teams strength (even, power play, shorthanded) and whether or not a player was playing at home. Adjusting for these factors we found player ratings that are highly correlated (p>0.95, with their raw faceoff win percentage. This suggests that raw faceoff percentage is nearly as good at rating players as statistically adjusted faceoff percentage.
More details on this can be found in our short paper on the topic. That paper is here: Faceoff Analysis.
Additional work done by our group on hockey can be found at here: Other Statistical Hockey Articles.


Leave A Comment