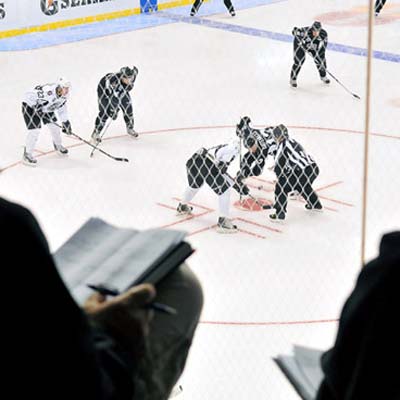
I attended the 2012 MIT Sloan Sports Analytics Conference last weekend in Boston. Additionally, I gave a poster and was invited to be part of the Hockey Analytics panel with Mike Milbury, Tony Amonte, Peter Chiarell and Brian Burke. NHL.com had a write-up of the panel here. I’m going to put together some posts/comments on that panel and some of the topics that came up.
The first of these is the topic of faceoffs. I said in the panel that it takes an additional 100 faceoffs wins to get an extra goal. As it turns out at 5v5, on average, it takes an about 165 faceoffs to get your team a goal but as we have a zero sum game, an extra 82 faceoffs gets you a goal differential. This is based upon just over 100,000 faceoffs taken at 5v5 over the past two completed regular seasons. What we (Schuckers and a student at St. Lawrence University, Jim Curro) did was calculate the probability that the home team scores – the probability that the away team scores for 20 seconds after each faceoff. We called this the NP20 for net probability at 20 seconds. The table below gives you the breakdown of NP20 by winner and by location for 5v5 faceoffs.
If we take a weighted average of the NP20 (weighted to reflect the distribution across locations) we find that the average NP20 gained by a faceoff win is 0.006094. Thus, it takes about 1/0.006094 = 165 faceoff wins to get a goal. That’s an average number but it gives a good guide as to the worth of a faceoff.
Winner |
Location(Relative to Winner) |
NP20 |
Count(n= ) |
HOME |
Offensive Zone |
0.01669 |
16241 |
AWAY |
Offensive Zone |
-0.01524 |
14765 |
HOME |
Neutral Zone |
0.00259 |
20085 |
AWAY |
Neutral Zone |
-0.00358 |
19546 |
HOME |
Defensive Zone |
0.00049 |
16412 |
AWAY |
Defensive Zone |
0.00012 |
16010 |
Some further details on the analysis that Jim Curro and I did can be found here.


Is there an additional small goal benefit to winning an ozone faceoff because your are more likely to draw a penalty?Especially since after icing def. team can’t change tired players and get the match ups they want.
There likely is that benefit but there are other counteracting events that cancel it out. So over the long term say past 30 seconds the benefits of having won the faceoff are gone in the aggregate.