So last week I was at the Joint Statistical Meeting in Vancouver. It was a great conference and I presented some work on spatial mapping of shot probabilities for shooters and goalies. My poster was on Monday the day that the Blackhawks signing of Turco was announced. The spatial probability mapping of the offensive zone for Turco is given below. Red indicates areas where goals are scored at a higher rate than average against him. Blue indicates areas where goals are scored at lower rates than the league average. We can see that there are a bunch of areas where Turco does below the league average. He seems to be particularly poor on his right side on close shots.
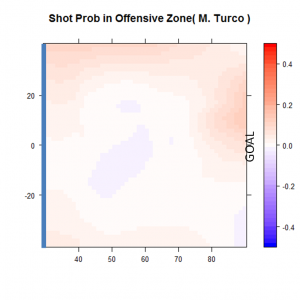 My poster was on Monday the day that the Blackhawks signing of Turco was announced. The spatial probability mapping of the offensive zone for Turco is given at right. Red indicates areas where goals are scored at a higher rate than average against him. Blue indicates areas where goals are scored at lower rates than the league average. We can see that there are a bunch of areas where Turco does below the league average. He seems to be particularly poor on his right side on close shots.
All of the graphs that we made of this sort are based upon shots (excluding penalty, empty net and shootout shots) for the 2008-9 and 2009-10 regular season. For each shot we have the x and y coordinates of the shot, the name of the player who took the shot, the name of the goalie in net for the shot and whether the shot resulted in a goal. We used a statistical method called LOESS smoothing or LOESS regression to create average probabilities maps for each location in the offensive zone (blue line at left and goal at right center). Essentially we took each location on the ice and we averaged shots close to that location (giving higher weight to closer shots and less weight to shots that are further away). The x-axis goes from 30 to 90 since the NHL measures shot location by distance from the center line.
For my poster I considered a good number of shooters and goalies including Crosby, Ovechkin, H. Sedin, Luongo, R. Miller, Brodeur (NJ), etc. But I was thinking after my poster session that it would be cool to compare Turco and Niemi and see how the Blackhawks did in this “trade”. Niemi’s map is given as the next image (at right). We can see from this that 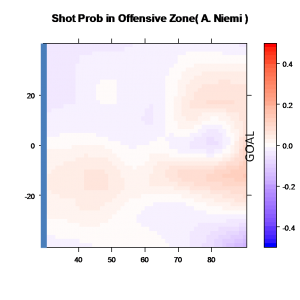 Niemi does better than Turco directly in from of the goal and at the edge of the offensive zone but both Niemi’s weaknesses are from the edges of the goal. I really like these graphs and I think that they can be really useful. But it still does not make for a real comparison.
My solution for a real comparison was to take all the shots that Niemi faced in the 2009-10 regular season and see how Turco would have done with them. So I did just that. I took the locations of the 934 shots that Niemi faced during that period and I found the probability that Turco would have given up each one. I added up the total to get the expected number of goals from those 934 shots that Turco would have given up. I got 88.7. Niemi gave up 85 goals. So that Blackhawks saved $1.45MM and it only cost them roughly 4 goals. Now that is with Huet also serving in goal. Huet played about 56% of the Blackhack minutes last year but more on him later. That’s pretty cool. Statistical models are awesome.
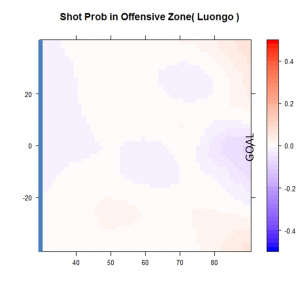
But now that I’ve done this I wanted to do more. I was being interviewed on Friday by a Canadian cable news show (The Standard with Peter Klein) so I wanted to be able to talk about Canucks if I was asked. So I thought what if Luongo faced those same 934 shots. So again we take the Luongo spatial map (see below) and we project the probability that Luongo would have given up a goal in each case and we find that Luongo would give up 8.5 fewer goals than Niemi. All Hail Luongo! Though some of the folks behind the scenes at The Standard were a little down on Luongo. I next compared a couple of other possible free agent goalies on Niemi’s shots. Below is a table of their results.
| Goalie | Goal Differential from Niemi’s 934 shots (higher is more goals given up) |
|---|---|
| Turco | +3.7 |
| Huet | -4.6 |
| Danis | -5.8 |
| J. Theodore | +0.8 |
| Luongo | -8.5 |
From this table, we can see that Luongo does the best and Turco does the worst. Huet does quite well but his salary is large ($5.6MM) and that is clearly cap space that the Blackhawks need. Danis and Huet both outperform Niemi as does Luongo. The unknown here is the salary demands that each was making. We don’t know what Danis was demanding but it seems that he would have been a better choice for the Blackhawks based upon the 934 shots that Niemi faced.
A couple of caveats here. First, we are using the shots that Niemi faced during the 2009-10 regular season and there is no guarantee that Chicago will face the same distribution of shots next year. This is especially true given the large number of personnel changes that the team is going through. Second, we note that we are only looking at the shots that a goalie is required to save so that blocked shots and missed shots are not part of this analysis. Consequently, some portion of these results is a function of the defense in front of the goalie. Third, there is variability in all these numbers but they seem to be quite small. A margin of error for all of the above goalies for a 95% confidence interval should be about 0.6 in the table above.
Finally a couple of questions naturally arise from this analysis. Leading off is what is a goal worth? How much money should a team be paying for not giving up an additional goal. Luongo makes approximately $10MM per year. How much does he save the Canucks versus having an average goalie in place? Or is he costing the Canucks money? We’ll finish with Luongo’s shot probability differential map (at right) which is very impressive. All Hail Luongo!
Full disclosure requires me to note that Peter Klein the host of The Standard was a college roommate of mine and is an all-around brilliant guy.



Please, label the axes.
The graph is the offensive zone in hockey from the blue line to the goal line.