 This past October I gave a poster at the Northern California Symposium on Statistics and Operations Research in Sports (NCSSORS ) entitled Shootout or Crapshoot: An Analysis of the NHL Shootout after Five Years. That poster can be found here. (It might be time to have a conference devoted to statistical analysis of hockey.) For that analysis, I considered all 5711 shootout shots taken during the 2005-6 through the 2009-10 seasons. The basic gist is that the NHL Shootout is a crapshoot. Put more statistically, there is not enough evidence to suggest that individual skill levels make a difference in player shootout performance. I thought I would summarize that poster and some additional evidence with this post. Peter Keating has now referenced this work in his blog and in ESPN The Magazine Random Mess(insider access required).
For the 2005-6 season the National Hockey League implemented at post-overtime shootout to determine outcomes of games. From 2005-6 through the 2009-10 regular seasons there have been 5711 shootout attempts. There have been 1878 goals which is a 32.88% success rate. I downloaded each attempt as well as the shooter and goalie involved and a couple of other variables from nhl.com. (Another nice source for data and statistical summaries of shootouts is nhlshootouts.com.) A couple of observations on that data are warranted.
1. There were 571 shooters and 112 goalies involved in this analysis. The players that are do well and those that do poorly are often those that we would not associate with being the highest skilled. Among shooters Alex Ovechkin was 13/47 (27.6%), IlyaKovalchuk was 9/37(24.3%) and Evgeni Malkin was 6/26 (23.1%). Among goalies Evgeni Nabokov was 54/145(37.2%), Chris Osgood was 26/67 ( 38.8%), while Johan Hedberg is 16/82 (19.5%).
2. Along with a student (Laura Daley), we looked at year to year correlation among players with more than 10 shots per year and none of those correlation were larger than 0.1. Thus, player performance does not seem to be related from year to year.
3. The distribution of shots faced or shots taken by player are heavily right skewed. That is, the distributions have a quickly decreasing number of players who take larger numbers of shots. For shooters the mean number of shots taken is 10.0 and the standard deviation is 11.6. For goalies the mean number of shots faced is 50.5 and the standard deviation is 46.2.
The figure at left is a 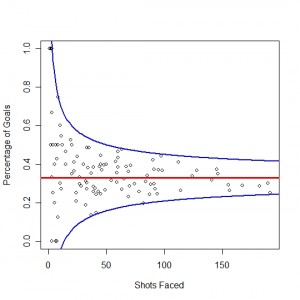 plot of goalie shootout performance. The x-axis is the number of shots faced and the y-axis is the percent of those shots that were goals. The league average is the horizontal read line and the blue lines represent a 99% confidence region centered at that average, i.e. 0.329 +/- 2.576 sqrt(0329*(1-0.329)/n) where n is the number of shots faced.
We can see that no goalie is appreciably outside the bounds. (NB: tolerance bounds might be a better choice here.) Marc Denis is the goalie that sits on the lower blue line at (41,0.146). So what we are seeing is that the variability in goalie save percentages is roughly what we would expect for a binomial process. Again this does not suggest that there is not skill differences between players (in this case goalies) but it does mean that the randomness (or noise) of the shootout is completely dominating the skill of the players.
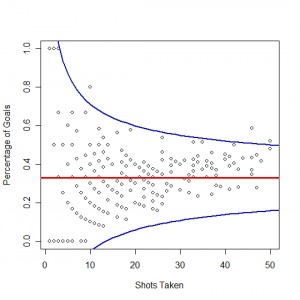
The next figure is the same graph as above but for the shooters, percentage of goals versus number of shots taken. Again we have the same bounds and again we see that the majority of players, all but three, fall inside these bounds. Note that if a binomial (coin-flipping) model was correct we would roughly expect that 1%, or about 5 or 6, of our 571 shooters to be outside these lines. In this graph there does seem to be a slight upward trend among the shooters. However, that trend does not fall outside of the bounds here.
To further investigate the impact of goalie and shooter simultaneously we considered a more sophisticated analysis. In the poster that I presented, the result of a Bayesian probit regression was done to determine the impact of shooters and goalies simultaneously. (Going Bayesian here is forced on us by the number of players who had either 0% goal percentage or 100% and the frequentist approach just can’t handle that. )The basic model can be summarized as:
yi ~ Bernoulli (pi)
pi = Phi(µ+ak+bj)
(µ,a,b)T~ N(0,100)
where yi is the outcome of the ith shot (1=goal, 0=no goal) taken by shooter j and faced by goalie k, pi is the probability that the ith shot is a goal, Phi is the cumulative Normal distribution, µ is the overall mean effect, ak is the effect of the kth goalie and bj is the effect of the jth shooter. The prior distribution, N(0,100), on the parameters µ, a, and b is a very flat one for the probit scale. This model follows Albert and Chib (1993) and was fit using MCMCprobit from the MCMCpack package in R.
After diagnosing for convergence we made 99% credible intervals (Bayesian counterparts to confidence intervals) for the effect of each player. Note that the effect of each player is the difference from the mean effect µ. Among these intervals we found one goalie whose credible interval showed evidence of performing better than the league average. That goalie was the aforementioned Marc Denis. We found that no shooter outperformed the league average but several underperformed. Among those with more than 10 shots, the shooters that underperformed were Michael Frolik 1/11 (9.1%), Marian Gaborik 2/18 (11.1%), Martin Havlat 3/18 (16.7%), DanyHeatley 4/25 (16.0%), Tomas Plekanec 2/16 (12.5%), Alexei Ponikarovsky 1/12 (8.3%),
Taylor Pyatt 1/13 (7.7%), Bobby Ryan 1/11 (9.1%), Michael Ryder 4/22 (18.2%), Stephen Weiss 4/24 (16.7%).
All of this evidence supports that notion that we can treat the NHL shootout as a coin flip. Now this does not mean that a coach should send out any random player. What it means is that for the shooters that are selected — the best on each team — and the goalies in the NHL there is not enough evidence after five years of performance data that among these players any one is better than another at the shootout. This is not to say that there is not skill involved in the shootout. Rather the skill is vastly overwhelmed by the noise and, so, the shootout is a crapshoot.


Leave A Comment